TL;DR: To create diagrams that can be updated from data in a file, I used Inkscape to create the layout, labelled all the diagram elements I want to update, put the data into a CSV file and used some Python code (with the ElementTree XML API) to update the SVG file.
I’ve been experimenting with a new project, WorldCupWallCharts.com (update: now defunct!). It’s a site where I create PDF wall charts that people can download and print out, to help them follow major sporting tournaments. It’s not really a development project, but I still found a way to write some code while working on it recently 🙂
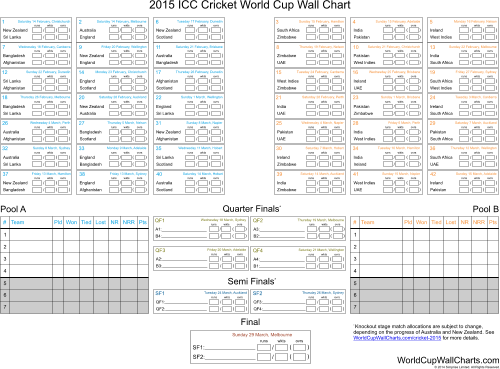
All the text elements on this diagram were typed in by hand…
Wall charts are a combination of diagram (the boxes and lines etc) and document (the text for the team names, dates etc). So it’s not totally obvious what the best way to create them is. Do you use a word processor (good for text, bad for diagrams) or a drawing tool (good for diagrams, bad for text)? Or maybe a desktop publishing tool would work best.
I felt that the drawing tool was a better bet to start with, so I created the first wall chart, for the Cricket World Cup, in Xara Photo and Graphic Designer. I’ve had this tool for a while, and I like it a lot. It’s easy to use and it’s cheaper than Adobe Illustrator, which I guess is its main competitor in the vector graphics space. I definitely wanted to use a vector graphics tool because it gives me much more flexibility to resize things without the blockiness that happens when you resize bitmaps, and I didn’t know what size the final page would be.
Xara worked pretty well, but one of the downsides for this project is that it’s tedious to edit the text. I ended up with a lot of nested boxes, each with bits of text in, like the date of a match and the team names. If I wanted to change the format of dates that I’d used, I would have to individually edit each of the text elements in the diagram. I also knew that if I wanted to re-use the diagram to make a wall chart for another tournament, I would have to go in and edit all the text.
So for a one-off wall chart, this was fine. But I have plans to create wall charts for a lot of events, and I don’t want to spend all my time double-clicking on text boxes to change the text. I knew I needed to find a way to create diagrams I could update automatically. I envisioned the layout of the wall chart (done in a drawing tool) as a separate thing from the details of the matches, which I could store in a CSV file or some other data format.
What About HTML and CSS?
At this point I considered another option. I could represent the matches in HTML, then use CSS to style and position those elements on the page. I could then use something like wkhtmltopdf to create the pdf file. I think this could work pretty well, but getting things to look right while fiddling with positioning and style in CSS is not my idea of fun, especially with so many elements on the page. I really wanted to be able to drag things around visually, as in a drawing tool, in order to get them looking right. So I abandoned this idea pretty quickly.
Enter Inkscape
Inkscape is a free, open source vector graphics tool. For this project, it has the major advantage that it uses the SVG format for its files. SVG is a variant of XML, and looking at the file in a text editor reveals something that is reasonably easy to understand. XML is also pretty easy to traverse and manipulate with a scripting language such as Python. (While Xara can export as SVG, I had no luck in getting it to import from SVG, which was also a necessary part of the process. Otherwise I might have been able to continue using it.)
With a bit of experimentation I realised I could add labels to elements in Inkscape, and I could see those labels as attributes on the XML elements in the file. This gave me a way to tag the elements that I would need to update.
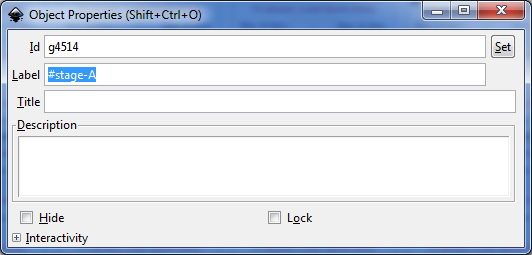
Setting the label of an object in Inkscape allows you to easily identify that object within the SVG file.
I decided to try this new approach while creating the wall chart for the Men’s Handball World Championship.
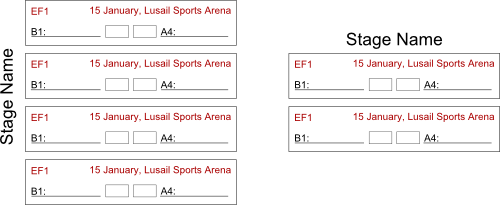
Section of the diagram before being updated. Note the placeholder text.
A Bit of Python
I created a CSV file containing data for the matches in the tournament. The first few rows look like this:
stage,match,date,location,team1,team2,match-name
A,1,15/01/15,Lusail Sports Arena,Qatar,Brazil,
A,2,16/01/15,Qatar Handball Association Complex,Spain,Belarus,
A,3,16/01/15,Al-Sadd Sports Hall,Slovenia,Chile,
A,4,17/01/15,Lusail Sports Arena,Belarus,Slovenia,
(The match-name field is only used for later stages, where the match needs to be given a name like QF3, for example.)
Then I wrote a bit of Python code to process the CSV data, and find and update the appropriate elements in the SVG file. I won’t post all my code because it’s kind of clunky at the moment and very specific to this project. But the pertinent bits are the use of the ElementTree XML API for parsing and updating the XML, and the XPath stuff for finding elements with labels. So to find and update a paragraph element with a label of ‘#team-1’, you would do something like:
import xml.etree.ElementTree as ET
tree = ET.parse('wall-chart.svg')
root = tree.getroot()
# turns out the text to update is usually in a flowPara which is inside of the element you labelled
team_element=root.findall(".//*[@{http://www.inkscape.org/namespaces/inkscape}label='#team-1']/{http://www.w3.org/2000/svg}flowPara")[0]
element.text = 'New Team Name'
element.set('updated', 'yes')
tree.write('modified.svg')
My actual code is a bit more complicated than this, because I figured out that I could save a lot of hassle by making sure that diagram elements were nested, with labels applied to the containing groups. So for example, all the matches in Group A were labelled as #match-01, #match-02 etc, and were then grouped together and given a label of #stage-A. Then I could copy that whole group, change the label to #stage-B and I wouldn’t have to change any of the match labels inside the group. That’s why the CSV above includes columns for stage and match.
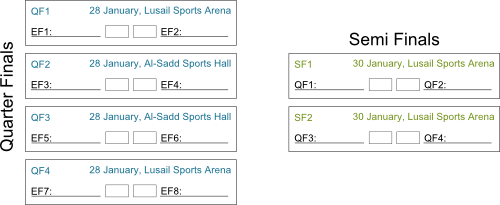
Section of the diagram after being updated by my script. Yep, I even updated the colours!
I actually think this way of doing things saved me some time even for creating a single wall chart, mainly because I could fill the diagram with placeholder text initially and let my script do all the updating automatically. And it will definitely save me a lot of time when I need to make additional wall charts with the same (or similar) tournament structures to the ones I’ve already made.